1

The Enterprise Analytical Environment, a flexible, time-to-market driven and governed approach

Once a corporation has an appropriate BI & Analytics maturity level defined and the drivers to guide her to an Agnostic Informational Architecture, it is possible to detail this architecture. However, we must always have in mind that “It is not all about data, it is all about business”.

Therefore, besides the drivers I listed and detailed in a previous article in this blog, the capacity of providing an ever-low time-to-market for informational solutions must pervade every single component of the architecture. Thus, I propose a generic framework to be adopted as the Enterprise Analytical Environment.

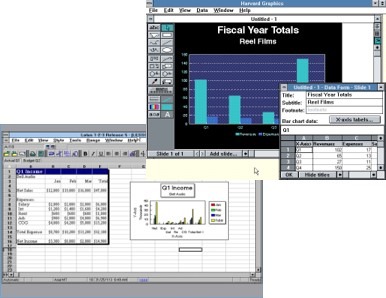
Before presenting it, we must discuss a little bit about the “time-to-market” of informational solutions. The recurrent incapacity to deploy informational solutions in a timely manner is the major complaint of reporting users, and the top reason for the proliferation of Excel spreadsheets all around the corporation, creating data silos. The new tools for big data and analytics are being sold now as the redemption for the business users, so they can finally have everything they always wanted and needed in a very simple and fast way. One of the big hurdles for this dream to become true is the emerging Data Swamps instead of the aimed Data Lakes. For a deeper discussion about this, I recommend an excellent article written by Daniel Sholleri at Colibra.com Daniel clarifies the many questions of the discussion:

“But because the economics of the data lake are so compelling, organizations have often begun by putting data into the lake without clear information about what currently exists”. This creates two outcomes:

1. The data in the lake is only usable by those who already knows what it is and what it means. If different users have access to the same data, they will create a replica and label it differently. The lake then becomes a silo, in which the shared infrastructure does not result in information sharing. At the end, copies tends to proliferate due to low additional storage cost.

2. As stored information becomes a babel tower, it is a herculean task to distinguish the data in the lake. And sadly, instead of at least organized and manageable swamp it turns into a pit of mud. One would not be able to separate the husk from the grain.

https://www.collibra.com/blog/blogdata-lake-vs-data-swamp-pushing-the-analogy/

Taking all this into account, I want to highlight another aspect of this anxiety for fast access to informational solutions and the use of the Data Lake as a solution. Blame the tools, IT professionals and governance for slow time-to-market of informational solutions. Imagining that a proper Data Lake will be conceived and built by end-users and good big data, data viz or other statistical tool is as naive as sailors charmed by mermaids. Software and hardware firms have excellent technical sellers whose chants are more effective than Calypso’s strategies to hold back Ulysses. Mythological metaphors aside, the thing is: businesses will not get rid form IT, an IT must have ways to deliver fast without putting corporate information at risk or let everything becoming messy.

What I advocate is an Enterprise Analytical Environment based in few obligatory components/layers, but well organized, easily and flexibly governed. This conceptual framework has 4 components with a set of layers in each of them. These layers provide more organization to the environment. Also none of the components/layers obligates data persistence or replication; they can be just a pass-thru to provide governance and usage track in some cases.


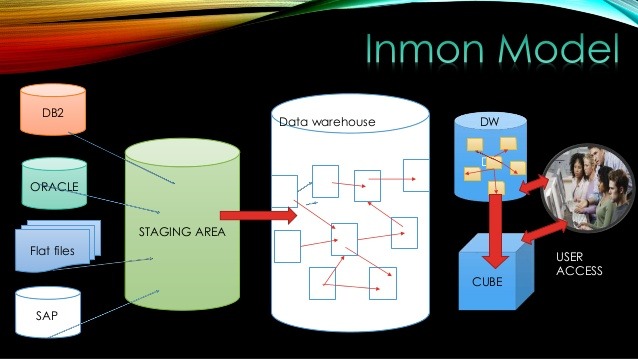
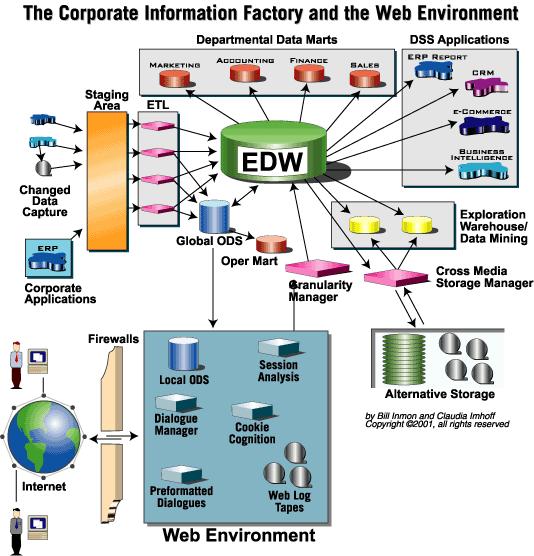
At this point, it is also noteworthy that it is not 100% clear what will happen to the EDW concept. If it will be incorporated by the advanced analytics/data lake, or if they will coexist architecturally speaking. A simplification could bring the EDW to become a layer of the advanced analytics component of the framework. For now, I’d rather represent it in a coexistent with an intersection area of them both, that can or not be merged in the future. That is why I choose to use a 3D figure to present the conceptual model where I can represent better this concepts being merged with an intersection area.

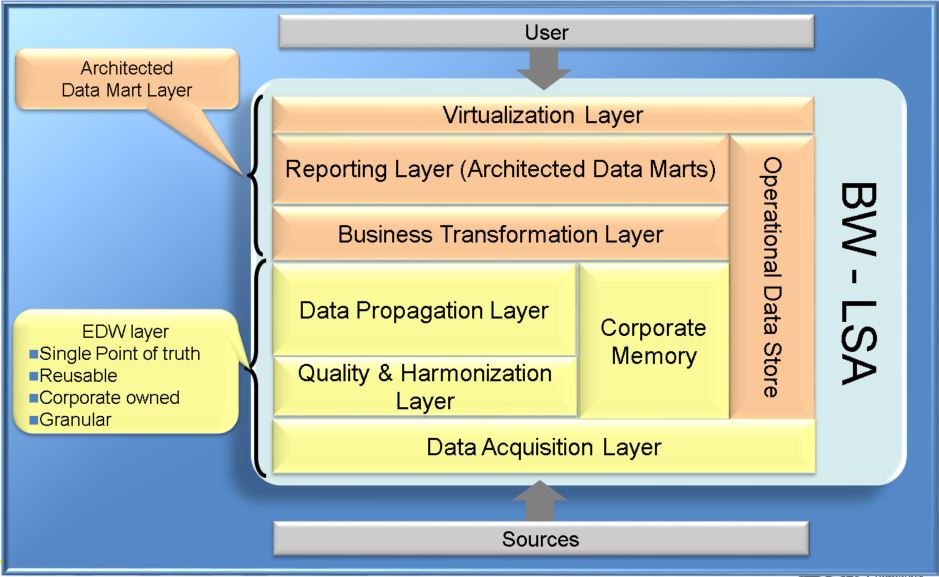
The components and layers of the proposed Enterprise Analytical Environment are described below:

But how actually can data/information be treated, used and published?

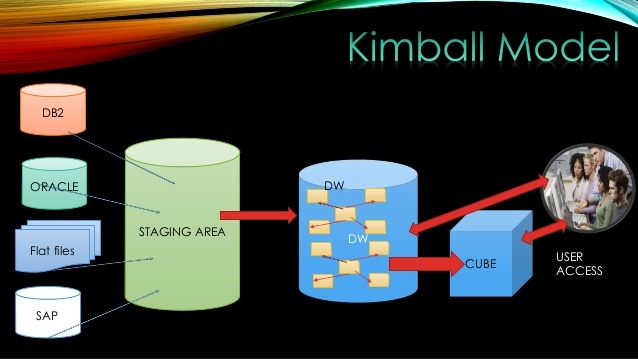
For this, I should say that there are three alternatives that are closely related to the need of data/information percistence. If the informational solution requires intense/frequent, complex and stable transformations of considerable amount of data, it is advisable to use the “Schema on Write” persisting the data/information.

On the other hand, if the rules to be applied requires frequent changes, the “Schema on Read” shall be adopted and no persistence (or minimal) is recommended. But, if a very little transformation is to be applied, then “Data Consumption”, also with no persistence (or minimal), is probably the best option.

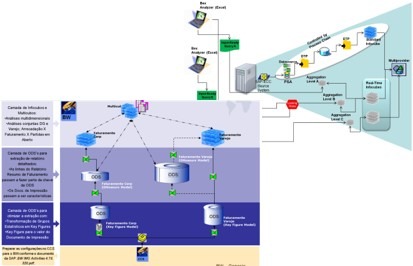
So, it is important to provide a logical model of the conceptual architecture in a 2D representation, where these three alternatives appear in possibilities of data flows.

The proposed framework also enables a simplified and flexible governance, through a quadruple segmentation:

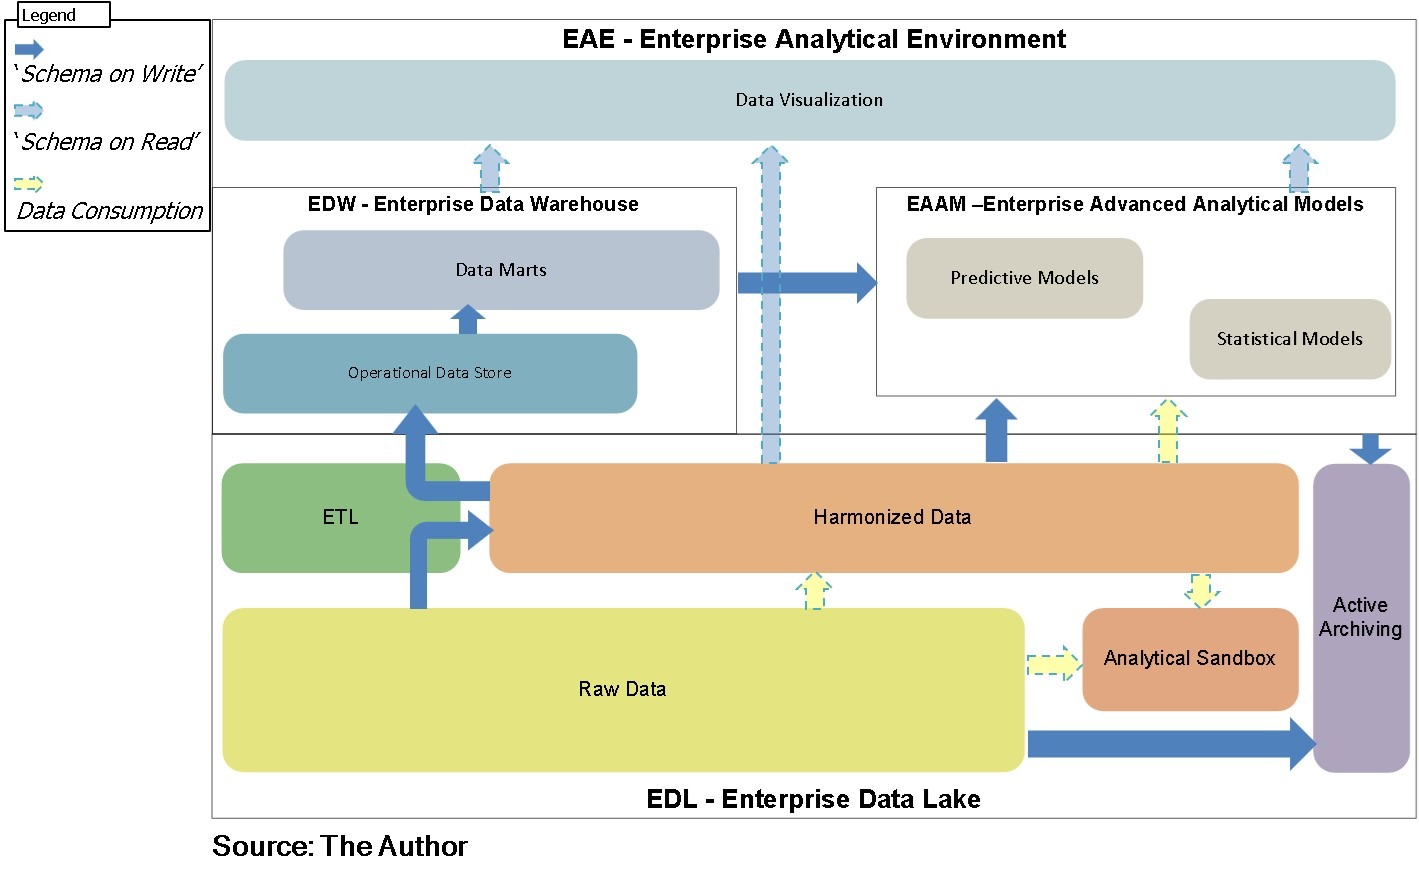
  1. The Enterprise Data Lake (EDL);
  2. The Enterprise Data Warehouse (EDW);
  3. The Enterprise Advanced Analytical Models (EAAM); and
  4. The Data Visualization.

This segmentation would ensure compliance within given safety standards and enable information democratization. Are we or aren’t we in the information age?

But segmentation shall be based on the concept of “content areas”, which are logical and physical grouping of data and information. There are three types of content area: Data Content Area (DCA), Information content area (ICA), and Master Data Content area (MCA). Each content area can have a different governance and ownership.

The rest is naming convention and specific technical standards of each tool. Yet, all of this can be interpreted as the “IT Structure” holding back the business with rules, standards, layers, etc.

But taking a closer look at the arrows that represent how data/information can be acquired, “digested”, used and published, if appropriate framework is in place, informational solutions can be delivered very quickly.

Suppose that the “power user” (best case with a data scientist support) that will have access to the “Analytical Sandbox” defines a data set from specific “Raw Data” and have the KPIs and the type of predictions they want. As soon as they feel comfortable with the model, this can be deployed and published within the proper DCA/ICA. The critical success factors of this approach are: power user’s knowledge, and an agile and simplified infrastructure and landscape (best case DevOps).

Of course, not all corporations are ready for this approach, but companies should definitely set it as a target for its IT strategy. One can also not forget that there should be a balance between IT knowledge experts and “power users”.

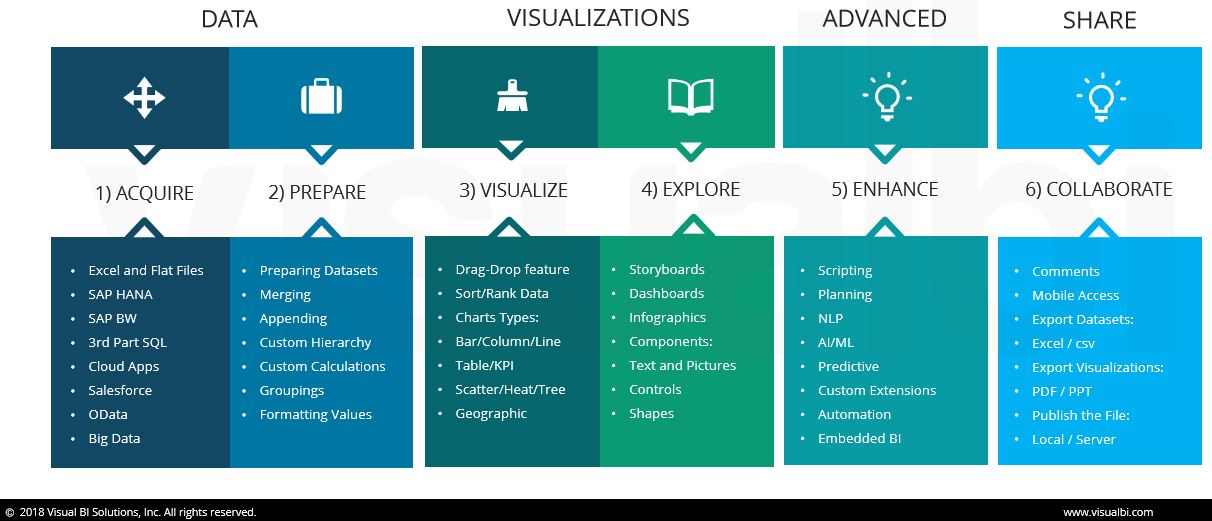
This balanced situation will also drive the choice of the best fit data visualization tool. An excellent and extensive study has been presented by Arun Varadarajan and Gopal Krishnamurthyii. In an in-depth comparison, they both evaluated the Visual BI and Self Service BI tools and proposed an evaluation criteria to provide guidance depending on power-users independence, as well as the BI & Analytics Maturity Level of organizations.

http://visualbi.com/blogs/data-discovery/self-service-bi-tools-comparison-tableau-power-bi-qlik-spotfire-sap-lumira-sap-analytics-cloud/

In sum, the Enterprise Analytical Environment I propose here is flexible, time-to-market enabled, well organized and end-user driven. It is not a matter of not listening to the several charming and “built to suit” IT sales pitch. It is a matter of getting to know better what you want, honestly assess how is your data, and take some time to detail the specificities of your company and implement the Enterprise Analytical Environment.

In the next posts, I will discuss how to “brand” the Agnostic Informational Architecture and how to create a roadmap to deploy the Enterprise Analytical Environment.

_______________________

i  https://www.collibra.com/blog/blogdata-lake-vs-data-swamp-pushing-the-analogy/ 

ii http://visualbi.com/blogs/data-discovery/self-service-bi-tools-comparison-tableau-power-bi-qlik-spotfire-sap-lumira-sap-analytics-cloud/


BI & Analytics Maturity Models, why it is important to find yourself?

Grow, improve, evolve, boost, enhance, these are the words you will always find in the visons, missions and objectives of companies, areas and departments. So, if you take Information Management and any of these words, how can you set a strategy if you don’t know where you are? What is your starting point and target, so you can define the roadmap?

A maturity model aims exactly in providing tools for you to find yourselves. But before the maturity model itself, IT must define the importance of Information Management on its strategy. If IT still struggles to provide users consistent systems and a reliable infrastructure, then a maturity model definitively is not what IT must focus. On the other hand, if systems are stable and infrastructure is trustworthy, then IT should focus in seeking for BI & Analytics Maturity Model to provide consistency to its BI & Analytics strategy.

The models I like the most are provided by TDWI(https://tdwi.org/Home.aspx), although Gartner (https://www.gartner.com/technology/topics/data-analytics.jsp)  and BARC (http://barc-research.com) also provide good ones.

One of the advantages of TDWI models is that you can do it by yourself without the need of hiring their consulting services, the other is that TDWI provides 2 different models one more BI specific and another in a wider scope for Analytics in general.

Since in both TDWI stablishes the Chasm concept to separate the earlier stages from the more advanced, I like to exercise using both for my clients.

Bellow I present a figure of each one of TDWI Maturity Models with legend for the concepts. The first one is the BI Maturity Model with the concepts oriented only by Business Intelligence. Note that in this we have 2 “interruptions” in the evolution path. The first being very slim and easily to be overcome, on the other hand, the second is extremely thick and can become almost impossible to overcome.

The second is the Analytics Maturity Model, here TDWI advocates the concepts in a wider spectrum, where BI is included in the Analytics. Another difference is that here there is only one “interruption” point. The “Gulf” concept is not present, only the “Chasm”.


The model to be used will depend more on the company’s culture than anything. If you want you can even use both. The classification in the model, must comprise a detailed assessment on the systems and within each business area reporting processes. In one front, the system assessment must aim the reporting processes against the productive systems inventory and infrastructure. And on the other the reporting processes must detail systems involved, manual process/steps, and integration with other business areas.

The most difficult is to make IT and business areas that hold some IT like experts to accept a bad/not good positioning, and at the same time make the Board believe that now, with the new investment roadmap the company will be able jump over the chasm and be ready for the Information era.


The importance of the Agnostic/Non-branded Informational Architecture – Part II

What should be the main drivers of an agnostic/non-branded Informational Architecture? More than list and detail the drivers, my focus is to open discussion upon them.

1 – Non-disruptive/Minimal disruption

Even in the companies which an informational architecture is not formal, it will be very hard to find, from mid-size to big ones, a company with 0 informational initiatives/investments. So, the starting point must always be: to be the less disruptive as it is possible, and the less technology-specific the informational architecture is conceived, the greater are the chances to mitigate disruptions.

But, the Informational Architecture must have to focus on a TCO reduction, and as the IT world walks in SaaS (Software as a Service) and PaaS (Platform as a Service)direction, an Information Architecture SaaS/PaaS based tends to be extremely disruptive to implement considering the importance of historical data for it. It is important then, to have an architecture that it is not economically consistent if it only reduces the TCO if it is SaaS/PaaS centered.

But it is not only regarding infra-structure the disruption should be avoided, remember we are in the eye of the hurricane, with users having almost everything available in the fingertips at home and having to wait 5-15 minutes for a report to run. In such scenario, buy and implement a SaaS CSV/Excel based is extremely tempting, almost all Data Viz tools vendors offer it, but for this, you don’t need an informational architecture. So, your architecture can allow the UI changes, but sould not be based on this change, it cannot be a Petit-Gateau, beautiful, delicious and that melts at the first spoon slice. So, if it is not possible to avoid disruption keep it at the minimal level.

2 – Multi-source enabled

It may look like a little obvious that an informational architecture must be ready for any source system, but nowadays this is not enough, the Big Data era brought the non-system produced data, or the unstructured and semi-structured data to use the expert’s terms, to the table.

And here goes my first golden advice for your design: you don’t have to define one solution for all sources. Although your logical model will need to be physically deployed, it can comprise more than one physical system landscape solution. Obviously, each solution will have its technicalities and specific governance peculiarities, but the different solutions need only to be complimentary.

Any advice can lead to a bad decision, so this one, if taken unwisely. So, let me be crystal clear here:   I am not recommending to have a Frankenstein in a well-polished & shining armor. Identify your sources, classify them and choose one solution for the non-system produced data and another for the systems produced data, and voilà your Data Lake is conceived.

3 – Multi-granularity capable

Since your Informational Architecture, necessarily must support solutions for all audiences, this awful and confusing DW/BI concept shall haunt you in all technical meetings. Basically, because a high level of granularity means to have the information more subdivided, in smaller parts, on the other hand, low level of granularity means information in more aggregated/summarized parts.

The best is that your Informational Architecture is enabled to provide all levels of granularity for the different types of consumers. Here, I have to make clear that I’m not talking about the rawness of the data, that has been left behind in the Data Lake. Here, it is about providing information, and for the whole corporation, not only “the techies” or “the geeks” of each department.

Then your Informational Architecture should have room for harmonized/cleansed data that can be directly consumed or be part of a Data Vault, a Data Mart or an EDW implementation.

4 – No data persistency obligatory

As data footprint reduction, should always be in the Information Architect mindset, and in-memory technology and SOA approach are more and more a reality for IT, it is extremely important that your architecture is not centered in data replication or data persistency, but in data consumption and the cold-warm-hot data classification policy.

So, for example, if data from an ERP is SOA exposed and no complex treatment is required, let’s say you only need some rank, percentage, and threshold-based analysis, it is most likely you can provide this without any physical data repository.

5 – Safe, simple and flexible governance

Meanwhile, end-users pray for IT independency in their reporting activities, IT must attend these prays forwarding some governance accountability for the end-users.

As the profile and rules must be created in a four-hands job, the day-by-day governance of the Data Viz tools shall be under power-user’s responsibility.

So, power-user assumes here, a huge role in this model. It becomes the owner, and not only of the information, but the owner of the informational process end-to-end. Of course, I am not saying power-user will become an IT professional and will be the responsible for everything (ETL maps, Jobs, Source Connections, etc), but as the owner, it will be the one to know the critical path of the information flows. Although the accountability is not much different from the one they hold upon that automated excel spreadsheet with 19 sheets and 47 macros, now the information constitutes a process itself.

6 – Allow different tool/solutions for one same layer

I assume that for now, you already understood that a proper Informational Architecture will have a multi-layer approach, and of course that the purpose of an agnostic model is not to be technology attached.

On the other hand, as I stated loud & clear in item 3, being agnostic does not mean to have dozens of technology providers, so you can choose the best-of-breed for each layer’s purposes, but you can also choose a central binding solution and use the best-of-breed approach for spot cases. And here goes the second golden advice this decision must be taken looking for the expertise level available in ETL tools, as well as how stable is your ETL operation.

7 – Enabled to use any end-user viz tool

For me, visualization tools are meant to be chosen like your tablet, watch or your bear, it is a matter of end-user preference. But this only can be near to the reality of the corporate world, under certain circumstances.

First of all, data life-cycle management must be mature, power-users and data scientists/analysts must be expert enough in the tools to not require IT support

Second, if this will be the approach users must be aware that IT will only give support for infrastructure issues, ensure the required drivers are properly installed and not corrupted.

Also, they must be aware that if they want use web-tools offered by these tools, they will need to opt for some SaaS on cloud and owns some level of its management, otherwise they will need to stick with the client version’s capabilities.

Alternatively, the corporation adopts one central tool with the IT providing support, but allow client versions with an IT support similar to the one provided for MS-Office tools.

But here it is important not to lose the TCO reduction from the radar, and under any circumstances start the design to solve the issues of the visualization tools adopted without a proper architecture, these issues must be only one more input.

In the end, it is the visualization tool that will represent your Informational Architecture so the end-user must like it and have trust on it.  And here goes the last golden advice: stress the visualization tools connectors and consider complimentary connectors suppliers, many times a 3rd party connector is better than the one offered for free with the tool.


The importance of the Agnostic/Non-branded Informational Architecture – Part I

Since I started my IT career in the early 90’s, up to the mid-2000’s, there is one thing that all my mentors, somehow, always asked for me: “A consistent and well-structured drawing of the solution”, no matter if they wanted to see it first as a sketch, on a board or in a piece of paper; or if they just wanted to see it directly in a presentation tool. This, was only related to the fact that the some were less focused on the beauty (for the sales) and more comprehensive to my daltonism than others, but the important is that I learned from them that informational solutions requires a drawing, and therefore it gradually became a habit, and it is as is has always been in my blood.

The reason is quite simple, data need to flow to become information. If you are proposing it to flows from one place to another, you got to draw the “from-to” and the “how-to”.

So far, no news for anyone minimally involved with IT projects, and for IT people things have been like this since God’s “Let there be light!”. But, as the years passed more and more systems were necessary, as well as integration and interfaces between them, sometimes increasing gradually, sometimes boosting the amount of generated data.

Happens that the data warehouses showed up, and with it, so the “popes”: Bill Inmon, Ralph Kimball and Dan Linstedt (https://blog.westmonroepartners.com/data-warehouse-architecture-inmon-cif-kimball-dimensional-or-linstedt-data-vault/)  three different approaches, but all of them highly drawing intensive; just google it, select images and you will see a myriad of schemes to depict this 3-in-1 below:

By that time, I was a SAP employee and SAP BW Consultant. SAP BW was much more conceived with Inmon’s approach than Kimball’s, although it is not uncommon to find, even nowadays, implementations applying Kimball’s concepts. But the agnostic models were academic discussions and normally just 2 or 3 slides as part of the sales PowerPoint. Furthermore, the most usual IT behavior was select the technology/tool, and then come out with the information Architecture, at least in Brazil.

In 2010, I was no longer at SAP for a few years, but still in SAP market, when I’ve been hired by a company (A) – one of the biggest in the world on its segment – that was not a SAP ERP user, but was migrating to SAP. This company already had a few BI solutions in place and treated Information as a very important asset, so much that Information was an Executive Directory. And my duty was to bring SAP BW knowledge to the organization, but support a hybrid informational architecture and be the counterweight of the implementing consulting company and my ex-employer SAP.

The company had already a very consistent conceptual informational framework, and the BW implementation was taking place completely disconnected from it and thru the dangerous path of using, Kimball´s approach for any reporting requirement in SAP BW.

In my first logging in the system, I found the most chaotic SAP BW implementation ever, after 8 years in more than 15 different companies. Things were so bad, we decided set-up new and fresh landscape, meanwhile in partnership with SAP, to develop a conceptual framework for SAP BW based in the one the company already had.

By that time, SAP in the seek to solve the innumerous “problematic BW implementations” came out with one particular approach for BW implementations in big and worldwide operations companies, the Layered Scalable Architecture, or just BW-LSA. BW-LSA became the dream of architects and the nightmare of non-senior consultants and consulting companies. Basically, it aims Inmon’s CIF approach in very well-organized, structured and governed manner. But BW-LSA itself shall be discussed in one specific post in the near future.

Back to this post main argument, the job of adjusting SAP BW-LSA reference model to the company’s pre-existent conceptual informational framework has proved its value only in my next assignment. First, because I stayed many years in the company (A) as an Architect and always with the responsibility to produce alternatives not exclusively SAP driven. Second, because once conceived and in place the BW-LSA needed a “Sheriff”, awful position that fell in my lap also.

My next assignment, now for a company (B) – 5th biggest in LA in its segment – was to provide an Analytics & Big Data Architecture. So, I thought that the challenge would be, acquire/update myself in the Big Data & Analytics technologies, but in the first meeting with the client, I’ve told that things were a little more complex, the informational architecture should be able to support the company´s next 10 years’ technology investment roadmap, that would leverage the company to operate in industry 4.0 mode.

Well, you cannot conceive an informational architecture that should be valid for the next 10 years based on technology A, or B, neither in technology provider X, Y, or Z. So, it was only then that I realized: the challenge would be greater than acquire/update myself in the Big Data & Analytics technologies, I would need to think agnostically to develop a design with no technology brands, no strings attached. Happens that now I was alone, just as in that old song “All by myself…

What should be the main drivers of an agnostic/non-branded Informational Architecture? Well, since the post is already too long, I decided to break the article in two, so that for now, I will rank the drivers but the details will come in part II.

  1. Non-disruptive/Minimal disruption
  2. Multi-source enabled
  3. Multi-granularity capable
  4. No data persistency obligatory
  5. Safe, simple and flexible governance
  6. Allow different tool/solutions for one same layer
  7. Enabled to use any end-user viz tool


BI, DW, Analytics and Big Data isn’t it all about the Reporting Business?… An Overview from Harvard Graphics to Big Data & Dataviz Tools

I believe that good part of BI, DW, Analytics & Big Data senior consultants nowadays have never heard about HG, or even know what these two letters stand for in the history of the Reporting Business. Harvard Graphics, or HG for intimates, was one of first top-market reporting tools.

It has started still in DOS world and could afford to hold its position in the preference of the reporting professionals up to mid-90’s, as well as Lotus 1-2-3, was the preference in the spreadsheet market, by that time the reporting activities were centered in the financial departments.

The main appeal of these tools does not differ much from the today’s self-service BI tools: beauty, ease of use, agility and IT independence. Louts 1-2-3, for example, had a special menu called WYSIWYG (What You See Is What You Get), which is also how SAP calls one of its new UI development tools. But from early 90’s to the first decade of 2000’s with downsizing and ERP’s (including CRM, SCM, B2B) waves, the reporting tools were relegated to second place.

The focus of the reporting business industry became to be, the Data Warehouse. Much due to technology limitations in processing the huge amount of data generated by the business transactions of the systems that I “packed” as ERP’s, but also much due to the business schools’ drivers of managing by KPI’s.

So, we saw the emerging of MIS and EIS, then the “star schemas”, ETL tools and the Data Warehouse, but all this has been developed to be held/supported by an entangle of IT processes, and requiring enrollment of many IT high skilled professionals.

The more IT departments invested in DWs, the more business areas looked for spreadsheets and desktop DB. They were doing just fine with HG and Lotus 1-2-3, and after they were “replaced” by MS-Office Excel, PowerPoint, and eventually MS Access the business moved on.

In these 19 years, what I have heard the most from my users was one single plea: “— Give me a solution where I don’t need to call IT!”.

Ok, and now what? We do have the technology to process huge amount of data, excellent and easy-to-use data visualization tools, the users are, more than ever, capable to use and understand the “computer world”. What to do next?

It is most likely that it is not by keeping attached to the DW paradigms era, centered in hiring tool experts to desperately implement magical and sold as fast IT solutions.

Many articles already have been written on the behalf of the need for a proper agnostic/not-branded architecture to avoid the Data Lake to become a Data Swamp.

I do share this vision, but IT buzzwords (nowadays Big Data Solutions) could never enchant me as consultant/advisor. It is not that I am an “IT innovations denial one”, but in each company I step in, I always ask first: what do you need it for?

So, let’s take the Big Data Solutions, for example. In one make-to-stock company, A; let’s say that 60 to 70% of the data used to run the business comes from an ERP or ERP’s like systems, the other 30 to 40% comes from specialist systems. Of course, that we can be talking about a huge amount of Data, but 80 to 98% of this data might be structured data, but it is not enough to look for a Hadoop alike solution.A consistent and well-structured BI/DW implementation, with a powerful hardware and power-user, governed Datviz tool seems to be more effective for the business.

On the other hand, if for the specialist systems the company has decided to heavily invest in automation with sensors spread in all its producing processes, then a so-called Big Data Solution should be addressed.

My point is: An Agnostic/non-branded and flexible Informational Architecture is important? Yes. Seek IT innovations following the market trends is wrong? No. For this, high skilled IT people will be required? Yes. But all this cannot be self-centered in IT, no matter how IT-intensive is the investment, the focus of the Information Strategy must be: to bring the Business Data that the business wants/need Back to Business.